We use cookies to make your experience better. By browsing our site you agree to accept all cookies. Learn more.
They Call It Cookie Love
February 25, 2021
The suspect list for the popular song ‘who stole the cookies from the cookie jar’ is growing. The craving for comfort drove demand for cookies. A recent survey by Top Data revealed that 95% of Americans admit to having at least 1 cookie per month.
We took a closer look at the recipe to discover what’s in the mix and here’s how it all baked up.
Cookie sales statistics, cookie eating statistics, Cookie infographic, cookie facts, cookie cravings, customer cookie cravings, cookies,
Chew on These Cookie Stats
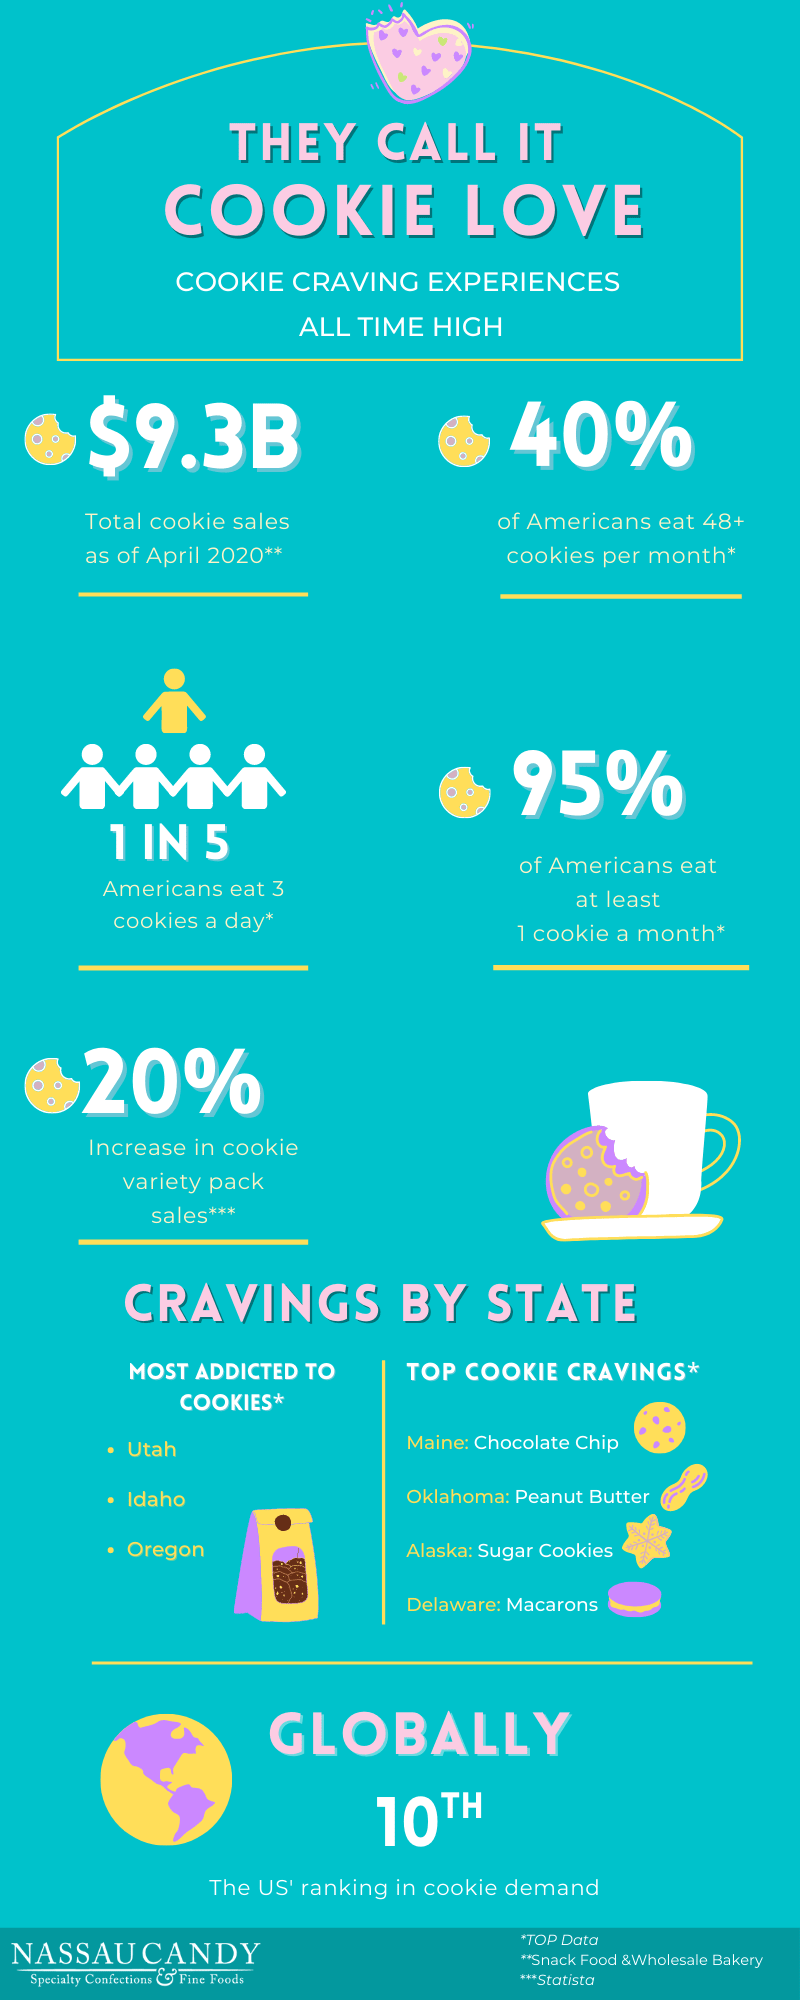
Seems like if you’re a cookie lover, Utah, Idaho and Oregon are the places to be. These locales are most addicted to cookies.
But stay clear of Louisiana, South Carolina, and Florida – these states are the least addicted to cookies.
If your cookie cravings lean towards the fancier side, head to Delaware — their top cookie craving is French macarons. For those leaning a little more classic with their cookie love – then head to Maine where their friend-chip with chocolate chip cookies is strong.
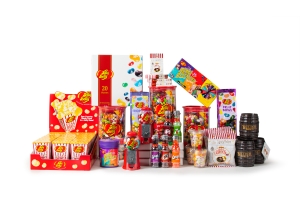
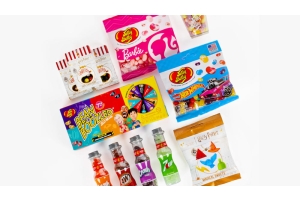
Even with particular states seem to have specific cravings, sales of cookie variety packs are up 20%.
Cookie sales might have totaled $9.8B as of April 2020, but the US only ranks 10th in cookie demand. Imagine that!
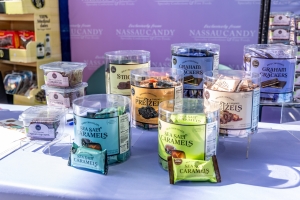
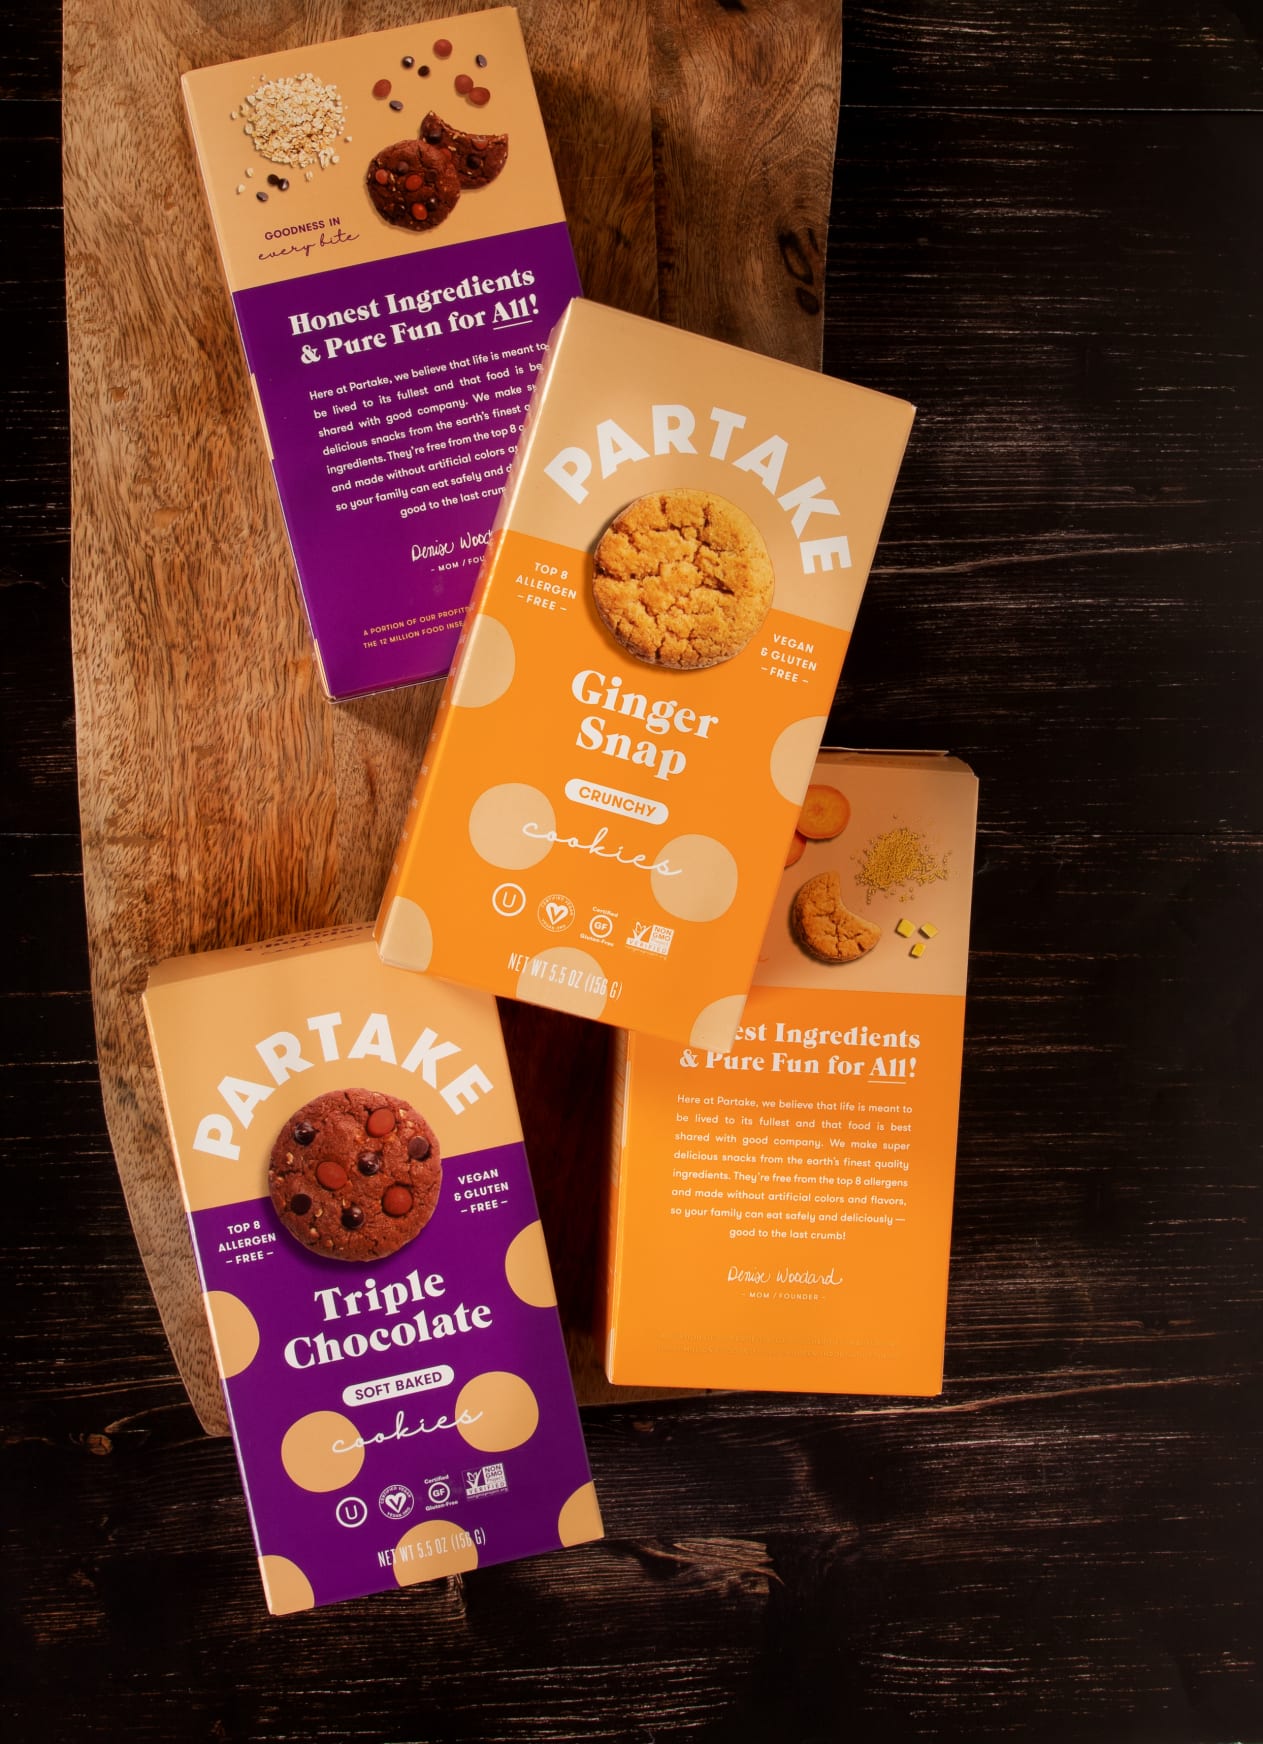
Whether customers are hungry for delicate European wafer biscuits, ooey-gooey chocolate chips, or hearty ginger snaps, we offer a batch of the world’s finest cookies to satisfy cookie cravings of all kinds including gluten-free, vegan, and protein-packed.

Share on Facebook

Share on X

Share on LinkedIn
Comment(s)
Recent Posts